Spring 2026 by the numbers: our first full season of tracking DFW tournaments
August 6, 2026
We launched OnDeck back in January with a simple goal: put every select baseball tournament in one place so coaches and parents stop bouncing between a bunch of sanction websites just to figure out what tournaments they want to sign up for.
Spring 2026 was our first full season doing that for real — tracking NCS, Five Tool, Perfect Game, PAC Sports, USSSA, 2D Sports, and 24 Sports across North Texas from the first weekend in February through the end of July. Now that the season's in the books, we pulled the data together just to see what it actually looked like from 30,000 feet. A few things stood out.
The season, in one line
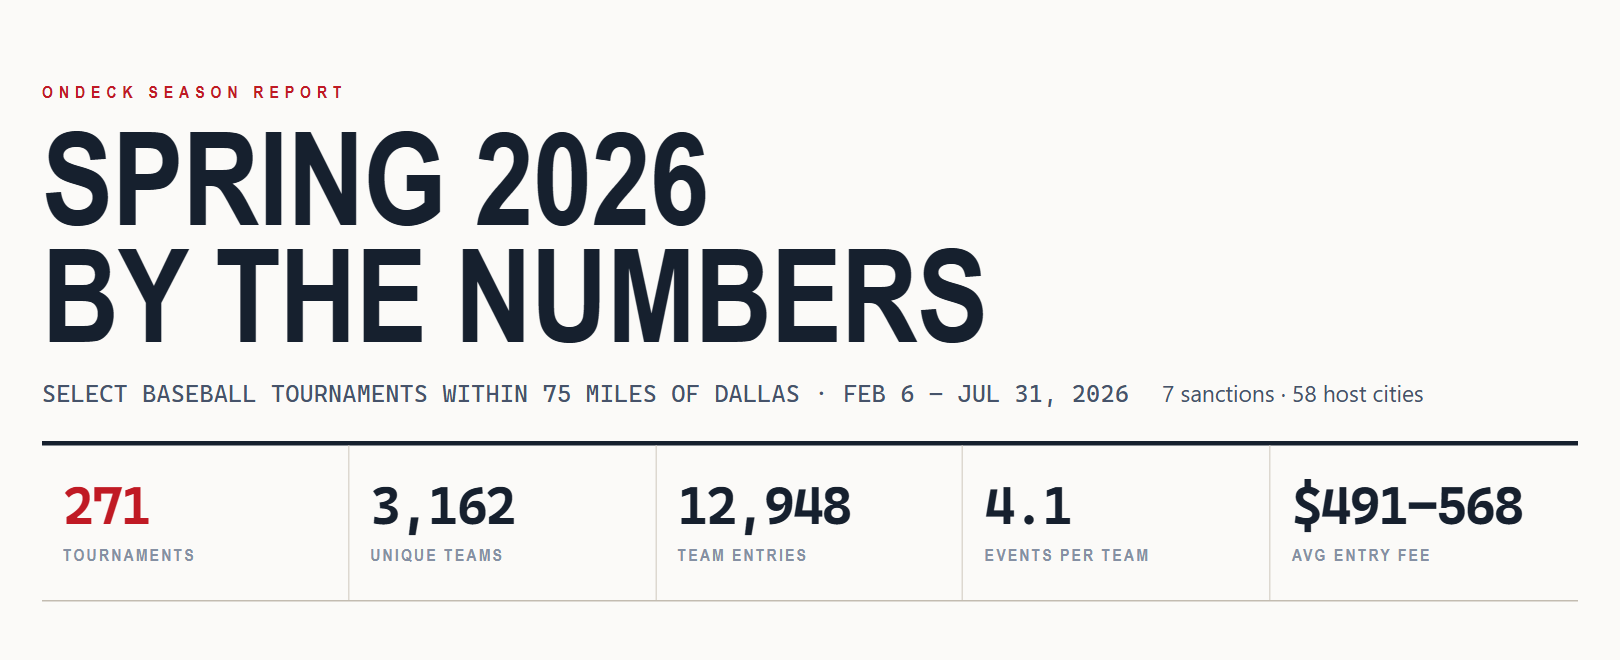
271 tournaments. 3,162 unique teams. 12,948 team entries. All within 75 miles of Dallas, spread across 58 host cities and 7 sanctioning bodies — all in one graphic. See the full Spring 2026 report, or jump to it at the bottom of this article.
Put another way: the average team played about 4 tournaments this spring. Some played a lot more than that — more on those teams below.
12U is the deepest bench — but high school is the bigger story
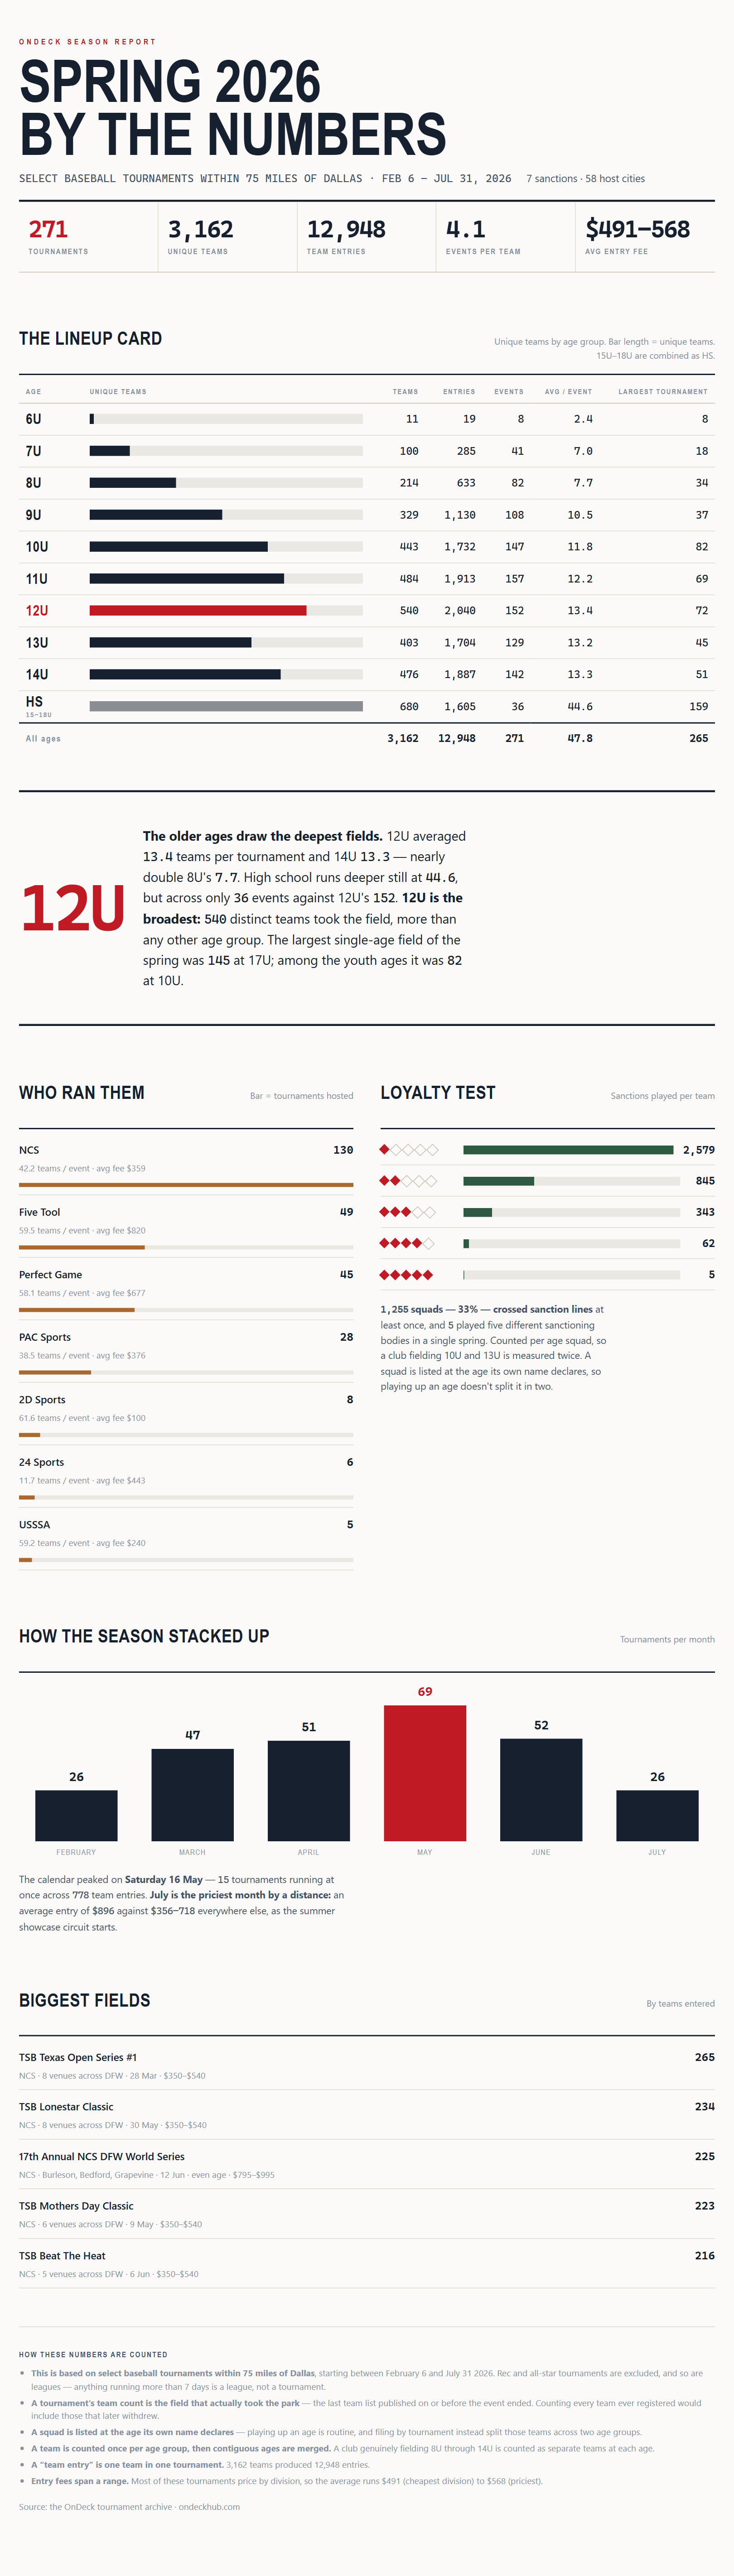
12U had more unique teams than any other single age group — 540 of them — and it wasn't close. It also drew the most teams per tournament of any youth age: 13.4, just ahead of 14U's 13.3, and nearly double 8U's 7.7.
High school ball (15U–18U) is its own animal. Those four ages together account for 680 unique teams — more than any single youth age — and they average 44.6 teams per tournament across 36 events, against 152 events for 12U alone. When high school teams play, the tournaments are enormous: the biggest one we tracked drew 159 teams. They just don't play nearly as often, because February through May belongs to their school teams. The club season is compressed into June and July, which is exactly why we extended this report through the end of July rather than stopping at June.
May had the volume, summer has the price tag
May was the busiest month by tournament count — 69 of them — but May 16th was the single busiest day of the whole spring: 15 tournaments running at once across four sanctions, 778 team entries between them. If your team played that weekend, you were one of a lot of families on the road.
Summer is where the money goes. The average entry fee climbs to $718 in June and $896 in July, against $356–400 from February through May — that's the showcase circuit kicking in, and it shows up in the numbers instantly.
The biggest single tournament of the spring
TSB Texas Open Series #1 (NCS), March 28 — 265 teams across eight venues around DFW. That's the largest tournament we tracked all season, in any age group.
One in three squads plays more than one sanction
We track which sanctioning bodies every team plays under, and it turns out loyalty isn't really a thing. 33% of squads — 1,255 of them — crossed sanction lines at least once this season, and 5 played all five. (We count this per age squad, so a club running both a 10U and a 13U team shows up twice.) Coaches are clearly picking tournaments on format, competition, and calendar fit — not on the logo at the top of the bracket page.
The whole season in one graphic
Every number above, plus the month-by-month breakdown, the busiest weekends, and the full age-group table:
Why we're sharing this
OnDeck was built to solve our own problem as baseball coaches, not to publish stats for the sake of it. But once we had a full season of clean data behind us, it felt worth pulling back and looking at what actually happened across the region — how many teams played in the DFW area, which ages draw the deepest competition, and how loyal teams really are to one sanction.
This is the first season we've had enough data to do this with confidence, and it won't be the last. We'll be back after summer and fall with more.